Sign In
Download the white paper and get INSPIRED
Learn how collaborative parametric design models allow you to work together for better solutions.
Why a hackathon?
Knowledge development is one reason for the IB decided to organize a hackathon. Addiotionally, besides getting acquainted with programming hands-on, they also wanted to experience what it is like working with VIKTOR.
As some structural engineers, such as Lester Neijzing, are currenlty part of a pilot project by the Gemeente Amsterdam in which VIKTOR is also being used, some are already a bit familiar with the platform. Now, the hackathon offers a great opportunity for the other structural engineers to get introduced to VIKTOR as well, and for those who are already acquainted to improve their programming skills.
"Participating in the hackathon is a fun way to get to know VIKTOR and learn more about programming with Python." - Lester Neijzing
Quay wall applications
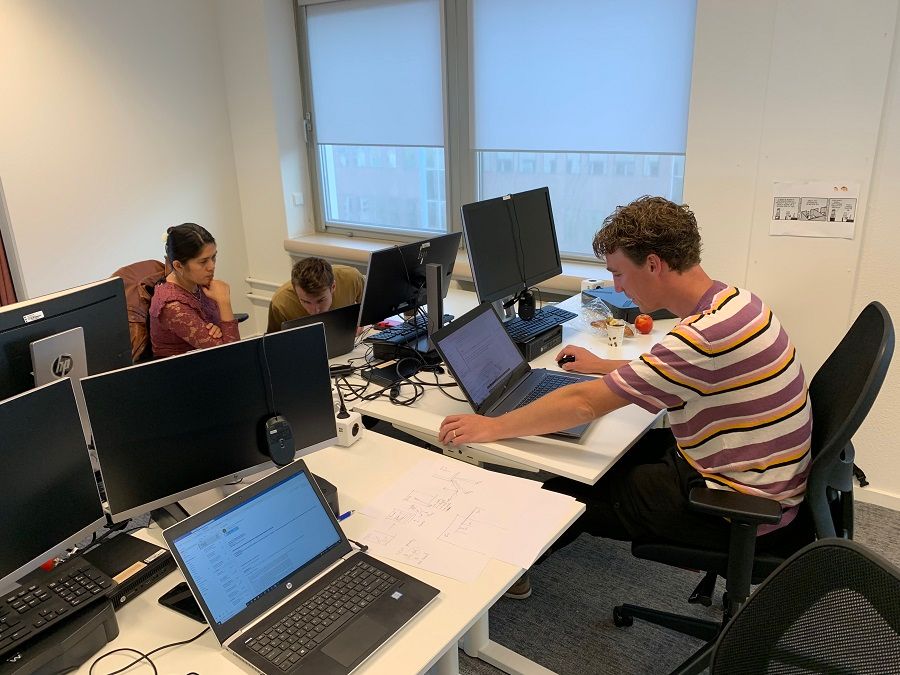
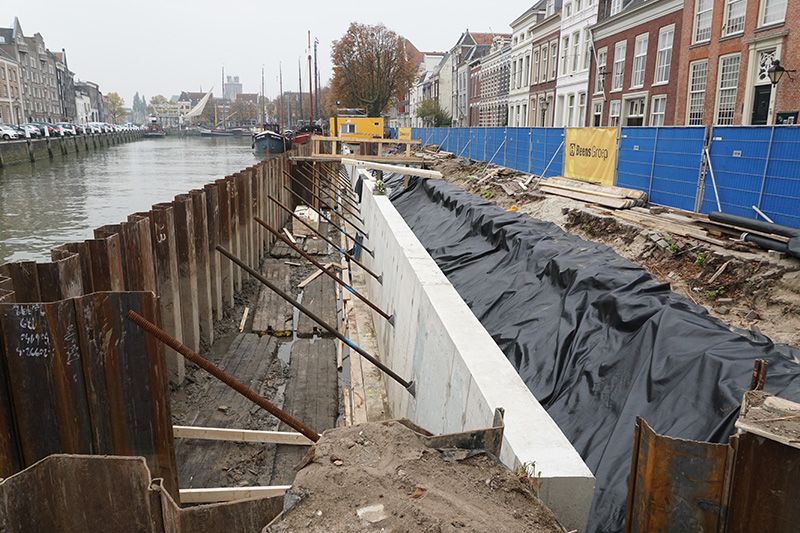
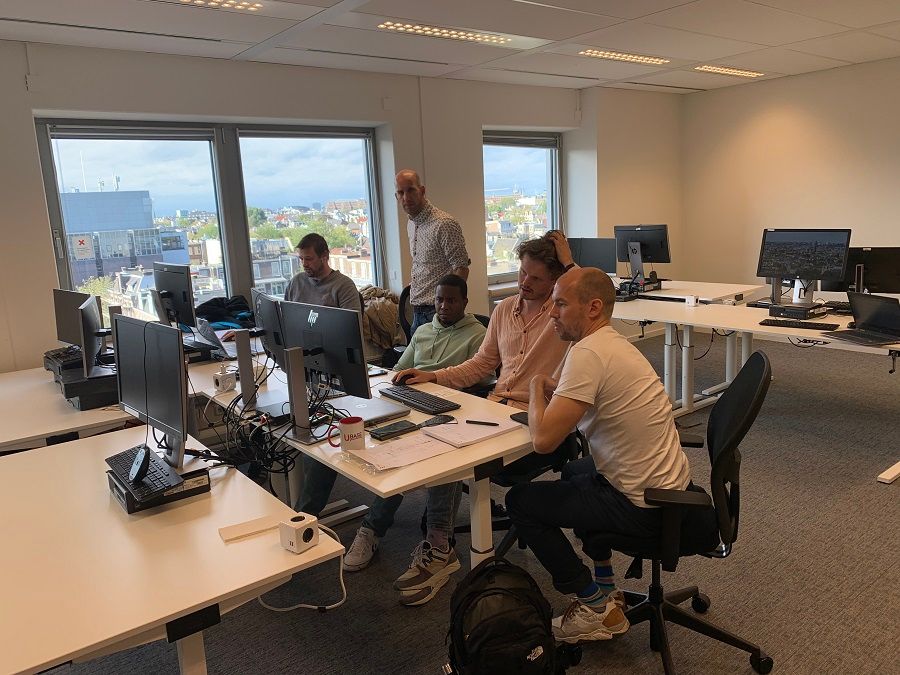
During the two-day hackathon, three teams used Python to develop applications on the VIKTOR platform. All of the apps are to some extend related to the parametric design application that Amsterdam is currenlty developing for the renovation of their quay walls.
The stakes were high during the event: In total, three apps were developed, but only one could be the winner and would thus be further developed eventually. Next, each app will be described in more detail.
Application 1
Currently, structural engineers at the IB gather data about the state of quay walls in Excel sheets. Even though this process works well for the people who work with these sheets on a daily basis, it is difficult for other to interpret the data. For that reason, team 1 developed an application to make this data more transparent and easily adjustable.
Of course, the IB could ask their GIS-department to visualize their data for them, but even then it would still remain a static process. With this application, engineers can visualize and adjust project data using different colors on a graphical map themselves. This also helps make it easier to explain to others why the work of the structural engineers is important and how they, for example, estimate workload and project duration.
Application 2
Justl ike team 1, team 2 also worked on an application for the visualization of project data. With their app, it becomes easier and faster to project geometries on a map view and translate these to the calculation program SCIA, and after that to Word to generate downloadable reports.
Because this app includes a rather far-reaching integration, it was not unfortunately yet at a usable level at the end of the hackathon. On the flip side, this does mean that there is still a lot of room to improve and expand the tool.
Application 3
Opposing team 1 and 2, team 3 developed an application not aimed at the visualization of project data, but for the automated design and modelling of foundation piles, channels, and the surrounding soil. For this, the team integrated an Excel calculation sheet with an export to the calculation program SCIA to their VIKTOR application.
Just like with team 2's application, there was still some work to be done before team 3's app was ready to be used on real projects. However, the results were promising so far and made for an interesting concept for further developments.
Choosing a winner
Based on the judge's critiques, a winner was chosen at the end of the second hackathon day: Application 1. Where the other apps mainly focused on integrating with pre-existing calculation software, application 1 stood out due to its unique use of data-processing and visualization - a nice use of VIKTOR that had not been done that often yet.
"I think it was this tool that won the hackathon because the rough outlines were already finished - the application worked in such a way that it produced the results that we were looking for. According to the jury, it was a unique tool, especially thanks to the maps and the visualizations." - Lester Neijzing
Putting the pieces together
According to team 1 participants Rick and Lester, even though they were part of the same team, they were constantly programming completely different parts of the application. Only within the last few hours of the hackathon, when they began putting all the parts together, it felt like "it magically turned into a working product".
The application consists of several different parts, For example, it shows a graphical map and Excel sheet with risk drilling and assessments of quay walls, using different colors to indicate wether a wall is still sufficient or needs reinforcement. Team 1: "The map view really makes the data come to life". Within the application, it is also possible to adjust source data, link it immediately back to Excel (or the other way around), and export overview reports.
"We knew what our vision was but did not yet realize how incredible it would be until we put everything together and it actually started working the way we envisioned." - Rick Voortman
What's next?
Following the hackathon, two things are certain:
- The further development of team 1's winning application
- A second edition of the hackathon
Are you also interested in organizing a hackathon with your organization? Don't hesitate to contact us at contact@viktor.ai!
Start building apps now
Related Blog Posts
Get our best content in your inbox
Subscribe to our newsletter and get the latest industry insights
