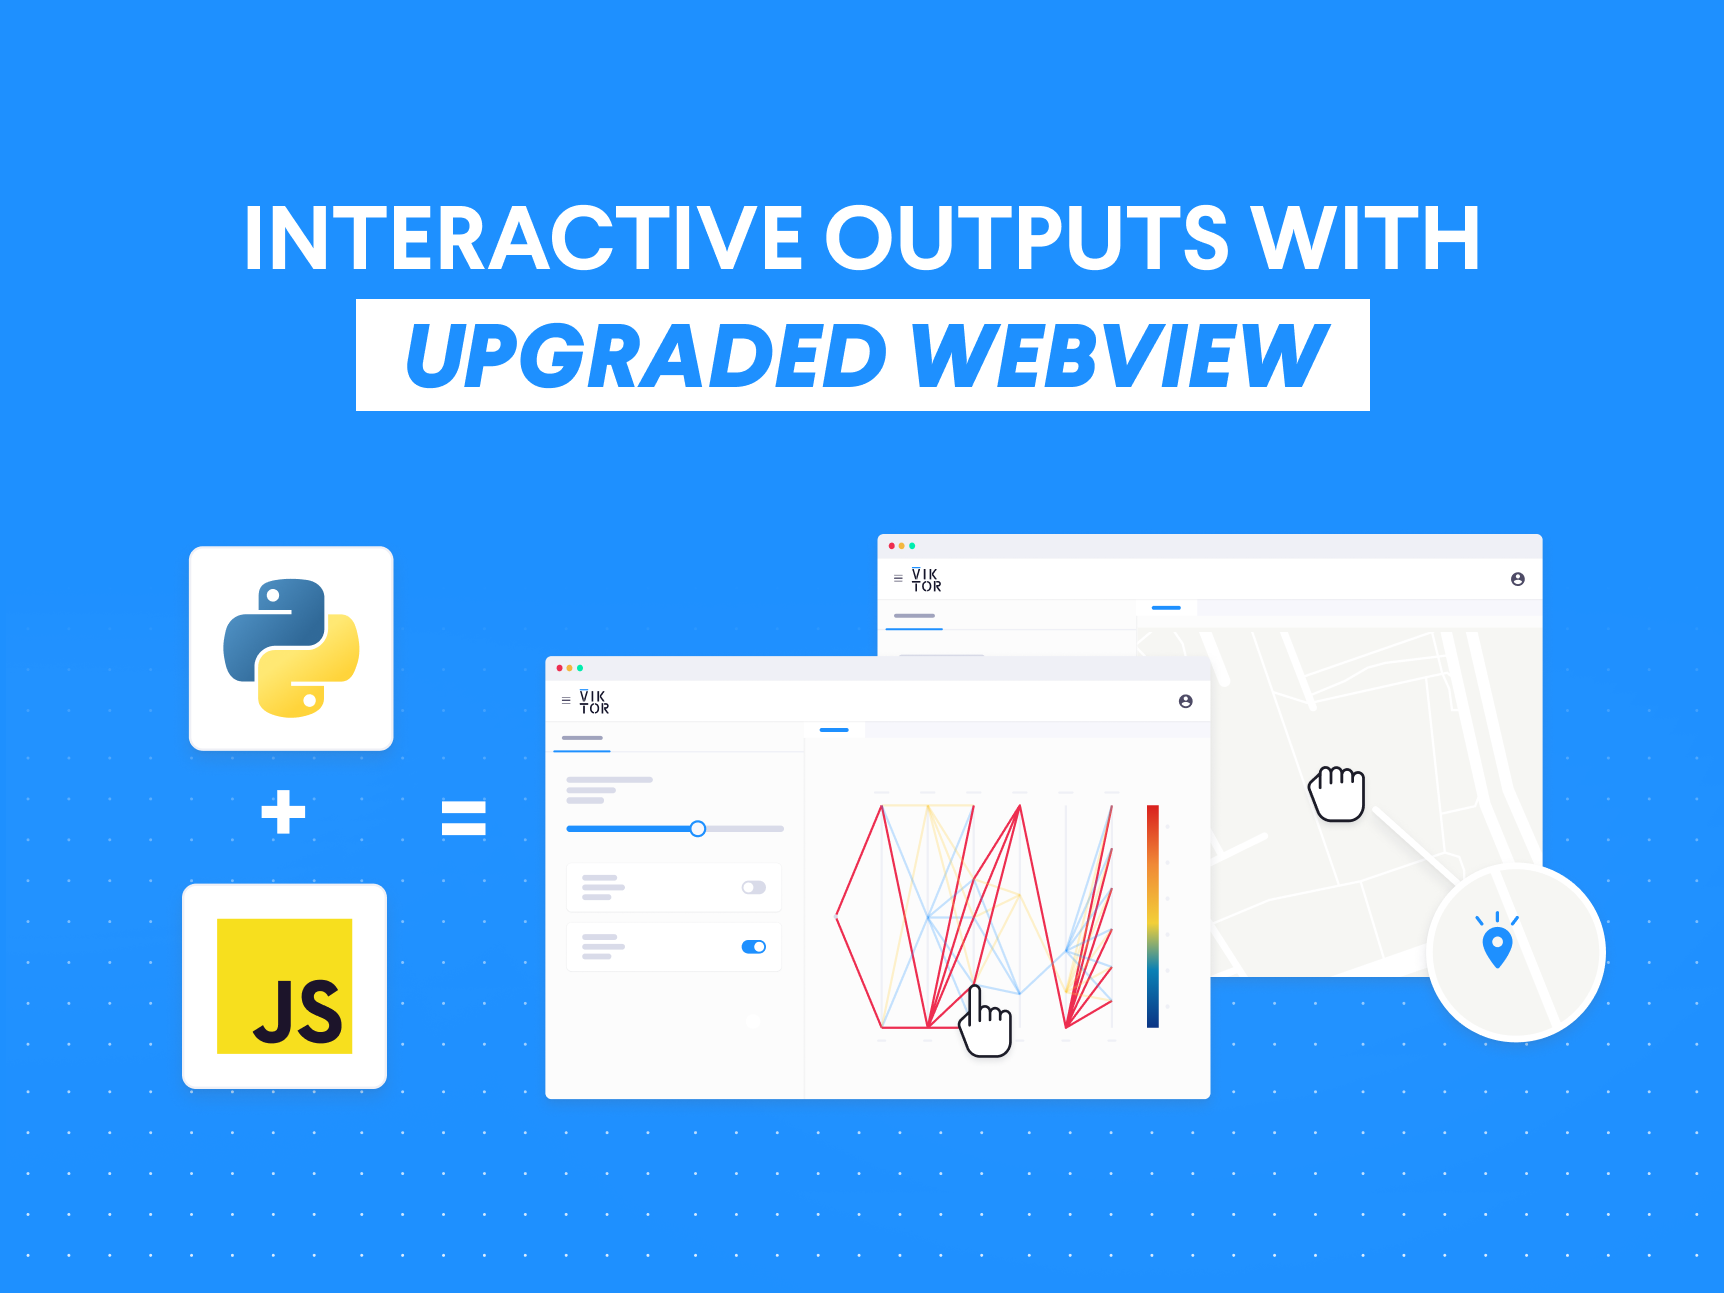
What did we introduce and why?
Well-versed programmers who have used VIKTOR before will know the WebView supports the functionality to render a standalone HTML page in a VIKTOR app. Any HTML page could be rendered, and that meant a lot more complex visualizations were possible. For example, a Python package such as pyVista could be used to render a mesh. The WebView has now been extended to allow for much more user interaction in the view, creating a much more intuitive user experience and a wider range of use cases.
Need some inspiration?
To give you a starting point, here are some examples to inspire you but also display the versatility the WebView now has. We have made all these apps available in a GitHub repository for you, so feel free to try out these apps yourself!
Draw on a canvas
One of the disadvantages of using Python for engineering is that geometry is defined in points and edges. A square, for example, has 4 points and 4 edges that are connected in a specific way. From a list of points and edges, it would take a few seconds to imagine what this would look like. If you have more points and edges, this becomes even more difficult, which is why engineering software often has 2D and 3D representations of the model.
For this example, imagine you are looking for space between buildings. you could outline the exisiting buildings and look if there is adequate space for another project. If the space is too small, the exclamation mark warns the user!
Selection of a point in the plot
Another great feature is that you can now make your plots talk to your parametrization. You can select a design point from a plot that you would like to explore and use it as input for the next step. In this example, you can clearly see how this improves the user’s experience. In the GIF below, you can see how Plotly is used in the WebView and lets the user fill the values in the Parametrization by clicking a point from the plot.
Parallel plot with optimization results
To extend on the previous example, with a parallel plot, you can easily filter visually. The great thing about filtering visually is that for a user, it is easy to understand.
In this example, the parallel plot is based on pile driving data, and the user can filter on the chart. Once happy, they can send the resulting values to the ‘Filtered Results’ table for inspection.
How can you start leveraging it?
The new WebView allows for an additional communication channel between the parametrization and the WebView. This lets you develop an application that can capture user actions and use them in another step or view!
To make this possible, we released a JavaScript SDK to make the connection possible. With the SDK you can send information to and save it in the parametrization. To achieve this, you will need to import the SDK and subsequently call the function ‘viktorSdk.sendParams’. This function accepts a dictionary of field names and corresponding values, which are then applied to the parametrization. The functionality is similar to the already existing ‘SetParamsButton’. An example of such a file would look like this:
1
2<!DOCTYPE html>
3<html lang="en">
4<head>
5  <meta charset="UTF-8">
6  <meta name="viewport" content="width=device-width, initial-scale=1.0">
7  <style>
8    * { font-family: sans-serif; }
9    button { padding: 8px 16px; outline: 0; border: 0; background: #1e90ff; color: #fff; cursor: pointer; border-radius: 4px; }
10  </style>
11  <script src=VIKTOR_JS_SDK></script>
12  <script>
13    function sendName() {
14      viktorSdk.sendParams({
15        hello: "VIKTOR"
16      });
17    }
18
19  </script>
20</head>
21<body>
22  <button onclick="sendName()">Send name</button>
23</body>
24</html>
25
If you have not worked with JavaScript before this may seem scary, but it’s not! Actually, it is quite easy, you just need to use the variable ‘VIKTOR_JS_SDK_PATH to import the JS SDK. This variable is automatically available in the Python environment of your app. Check out the code below to see how you can properly reference to the JavaScript SDK:
1
2import viktor as vkt
3
4import os
5
6from pathlib import Path
7
8class Parametrization(vkt.Parametrization):
9
10    hello = vkt.TextField("Hello")
11
12class Controller(vkt.Controller):
13
14    parametrization = Parametrization
15
16    @vkt.WebView('Web View')
17
18    def get_web_view(self, params, **kwargs):
19
20        html = (Path(__file__).parent / 'example.html').read_text()
21
22        html = html.replace("VIKTOR_JS_SDK", os.environ["VIKTOR_JS_SDK_PATH"] + "v1.js")
23
24        return vkt.WebResult(html=html)
25
The result of these few lines of code will look like this:
For the full explanation and a list of some Python libraries that offer HTML export, check out the page on the docs!
When you want to write out the code for the JavaScript script, you may wonder what the easiest way is to do this WITHOUT any prior experience… the simple answer is large language models (LLMs), or Artificial Intelligence. You may have found ChatGPT to work well in a conversation, but such an LLM is also a great coding assistant! With the right prompt, you can turn your ChatGPT into a great coder! And this goes for other languages such as Python too!
To get started, you can copy the following prompt and give it a try:
“Imagine you are a structural engineer who is also proficient in writing Python and JavaScript. Write an interactive web-based tool using HTML and JavaScript to {what you want to make}. The key requirements are:
-
It must be a single, standalone HTML page
-
It cannot use any React components
-
{a list of your requirements for your webview page}"
By using this template, you turn the LLM into a programmer and immediately give context through a series of requirements for the LLM to satisfy!
Keeping the human in the loop (conclusion)
We've explored a range of exciting possibilities with the new WebView, from interactive maps to dynamic plots. These enhancements are designed to expand your toolkit, providing you with more ways to create intuitive and powerful applications.
It's important to note that these new features are not meant to replace human expertise, but rather to augment it. At VIKTOR, we firmly believe in keeping the human in the loop. These tools are here to support your decision-making process, making it more efficient and insightful while still relying on your professional judgment and experience.
Ready to explore? Try out the free version of VIKTOR and start experimenting with the new WebView features today.
For a comprehensive guide on implementing these new WebView capabilities, check out our detailed documentation page.
Start building apps for free