Challenges in checking steel connections
There are many tools and ETABS plug-ins available to help with connection design. Many countries even provide standard or prequalified connections with known and tested capacities, which helps speed up the process. Still, even with these tools, the workflow often requires going through thousands of Excel rows exported from ETABS and manually checking every cross-section and load combination.
The process of checking steel connections usually involves the following manual steps:
-
Creating a database of connection types and capacities.
-
Exporting the structural results from ETABS to Excel.
-
Assigning the connection types and capacity based on the element's cross-section.
-
Checking the connection by comparing the internal loads to the capacities for each load combination.
-
Reporting.
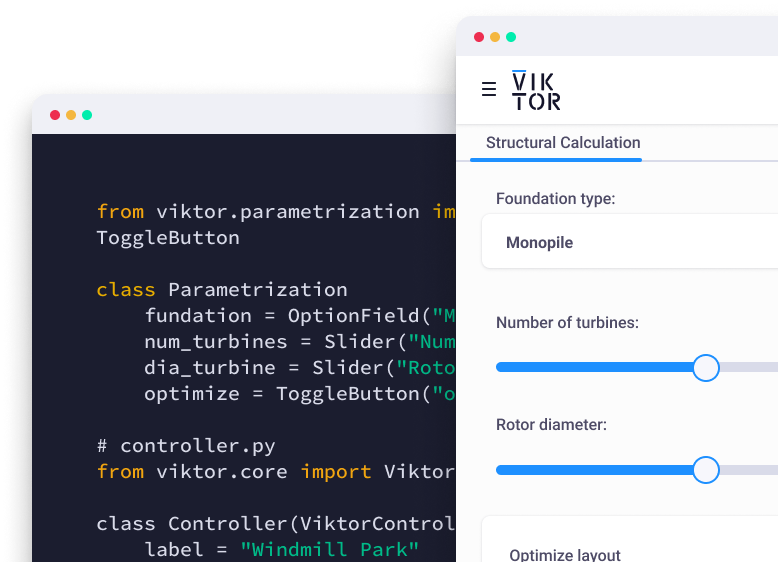
As you can imagine, performing all of these manually is quite difficult and time-consuming. Luckily, each of these steps is easy to automate if you have basic Python skills. However, making the results accessible requires more than simple Python code. You also need to create the visualization of your app's inputs and outputs and generate tables and reports that can be shared with your team. This can take a lot of time and may even require a large team of developers.
Instead of coding all of this yourself, you can use an application development platform that lets you quickly build these applications without the trouble of dealing with UI and integration.
To show how this works, I built an example of an application including all the steps we talked about to solve these challenges on the VIKTOR platform. Keep reading to see how this app further simplifies the connection design process!
Creating connection capacities database
The first component of the workflow is creating a database of connection capacities. This database will vary based on your region because it uses standards and manuals from local codes, such as AISC, ASI, or Eurocode (most likely, you already have this implemented in your company).
For this app, we will create the database in Excel with details on cross-sections, connection types, and their respective capacities. Then, using pandas, the Excel file will be converted to a JSON file and a Python dictionary for efficient data lookup. In the video below, you will see sample tables of prequalified connections and a sample Excel file and JSON-formatted data.
Exporting results from ETABS
Now that we have the connection database, we need to make some steps in ETABS to export the data. First, you have to assign elements to design groups using the built-in grouping feature. This helps group elements by their connection types. For example, secondary beams or joists with shear connections should be grouped together, primary beams with end moment connections should form another group, and base plates or column ends should also be grouped separately.
Finally, run your analysis and then export the results in an XLSX file. Make sure to include all the tables as shown in the video below.
Upload and visualize your model
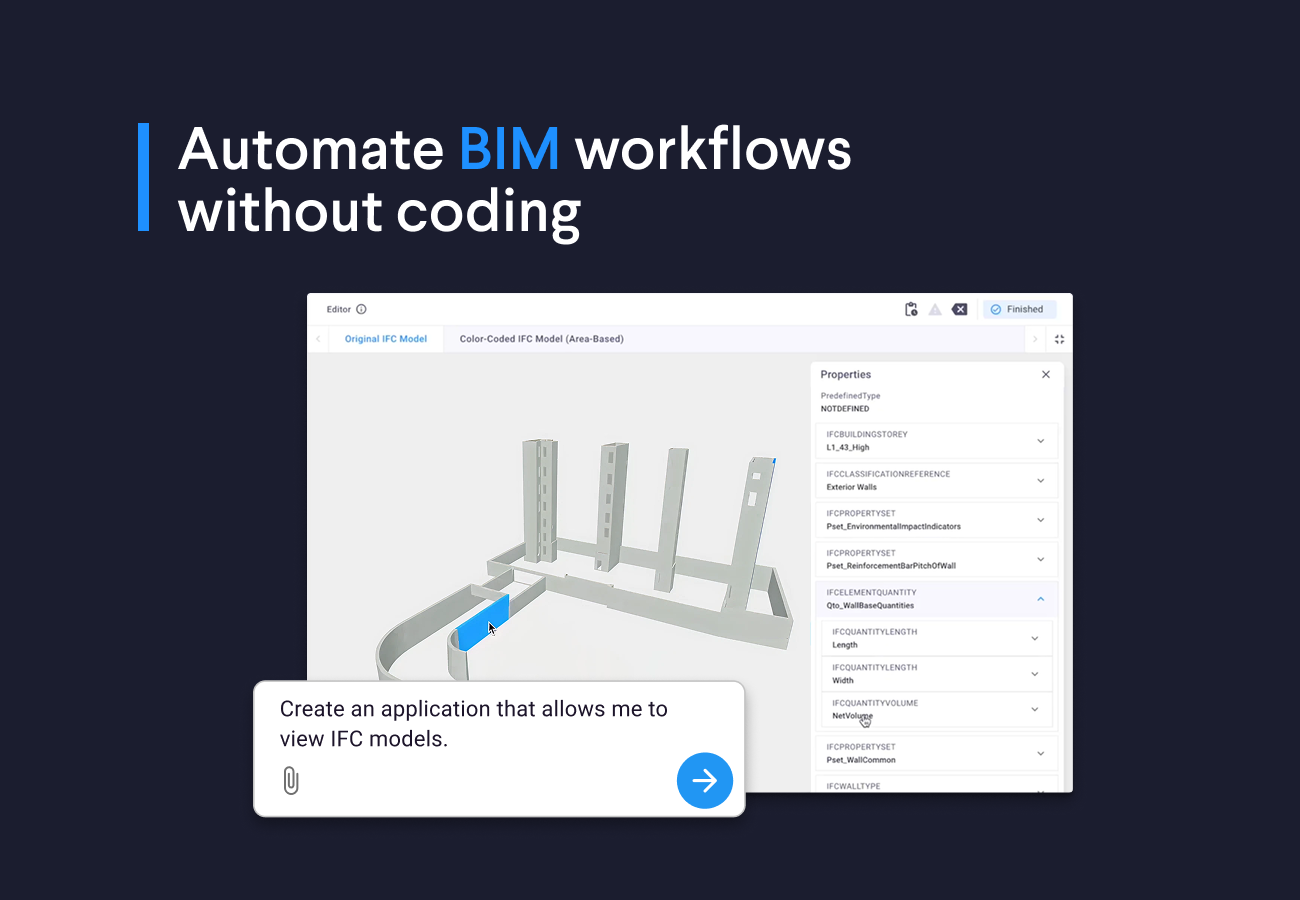
Once you have your Excel file with all the results from your structural model, you can upload it to your web app. VIKTOR allows you to create components to upload and visualize the results of your ETABS model. Under the hood, Pandas is processing the data from your Excel, and VIKTOR generates the inputs fields and a 3D model of your structure in your app!
Assigning connection types
Now we need to assign a connection type and capacity to each group. The app allows the users to assign connection types and capacities to each group using VIKTOR’s DynamicArrays, and provides a display of the 3D model with colors indicating each design group to make verification easier.
The best part is that you can select between designs or check the connection without leaving the app—just pick the analysis mode from an OptionFieldand the backend of the app will know how to handle each mode!
Connection checking
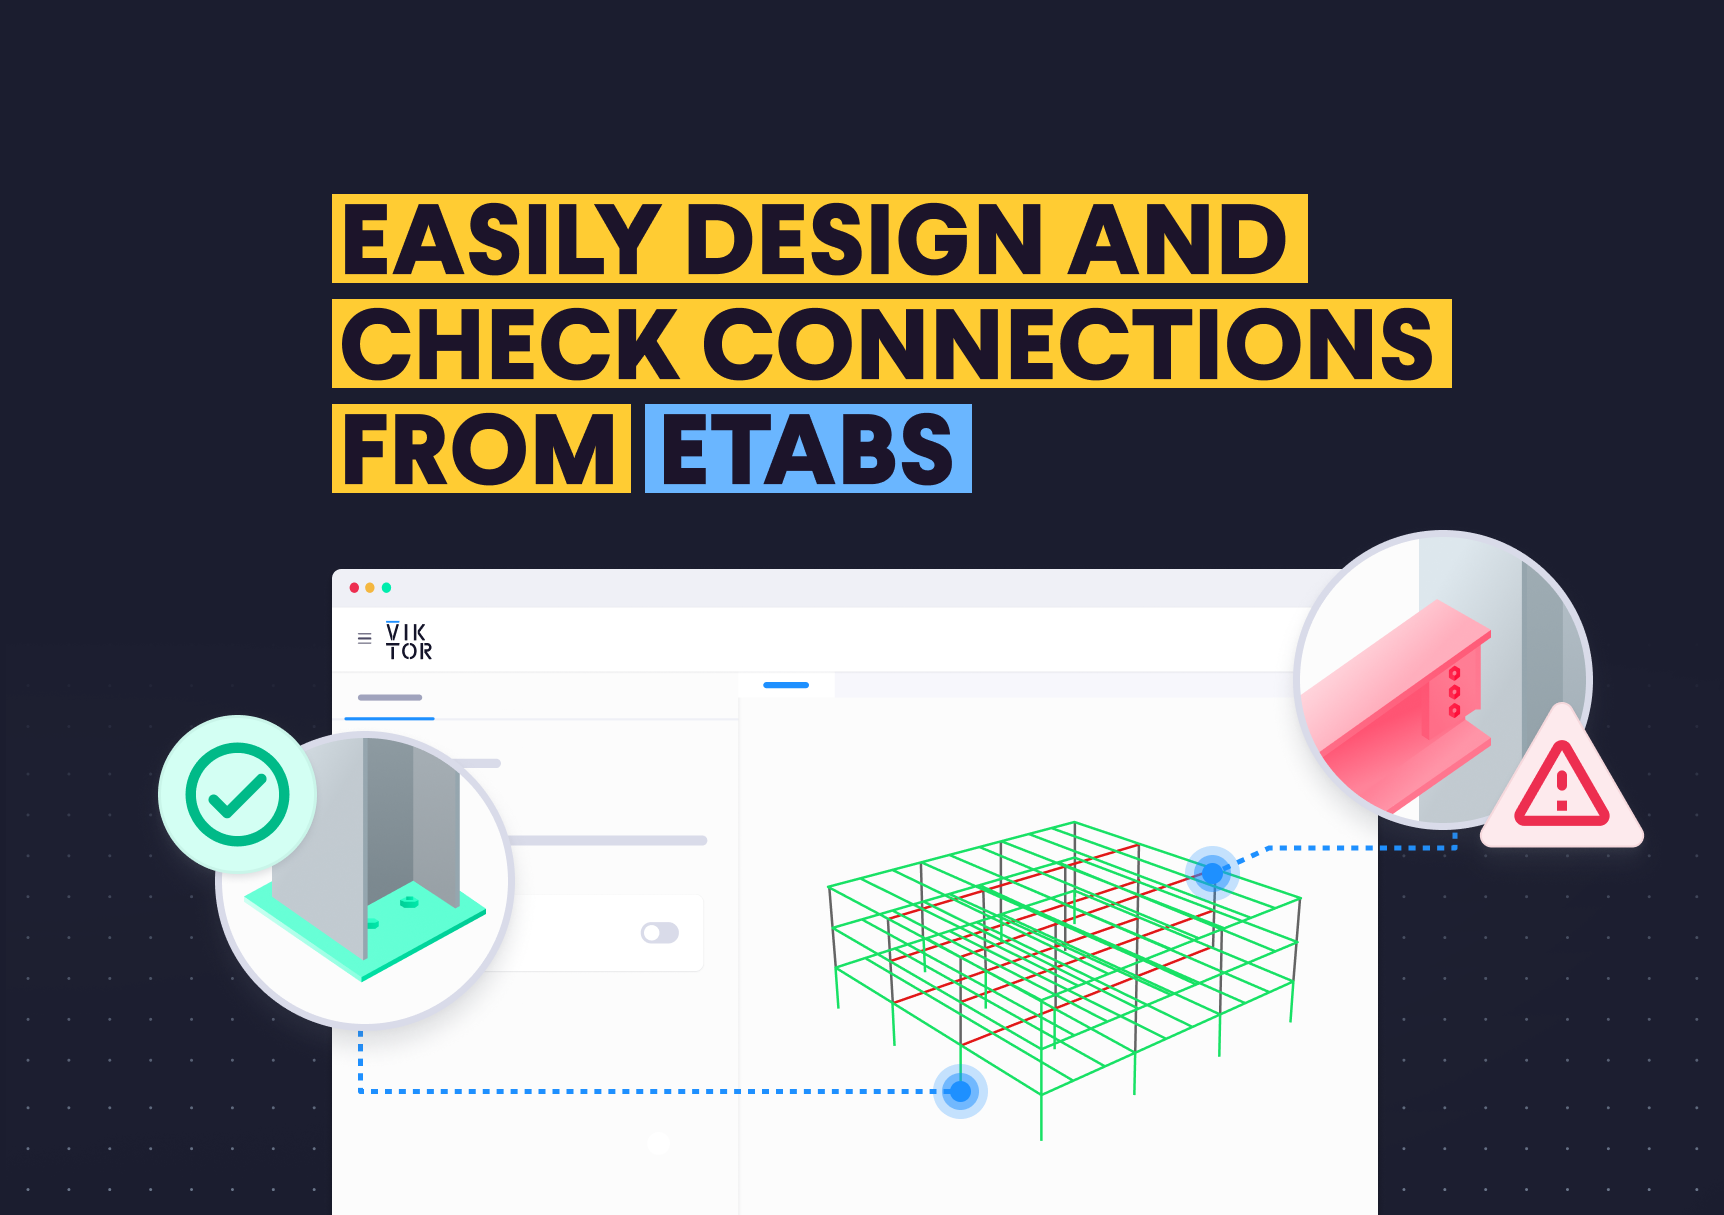
I’m sure you know that comparing the element internal loads with connection capacities and checking if they comply or not is not easy and can lead to results that are hard to understand. To solve this, the app checks this for you and provides a 3D visualization (GeometryView)](https://docs.viktor.ai/docs/create-apps/results-and-visualizations/threed-model/) that uses colors to highlight non-compliant elements. Additionally, the app lets you select a load combination from a dropdown (OptionField), where Pandas and Python handle the filtering in the background, making it easy for you to focus on the results.
While 3D visualization is helpful, showing too many details at once can make it messy. To address this, the app also provides a TableView that lists loads, capacities, and results in a clear format. Users can easily review the data without losing track of important information.
Reporting
Preparing reports can be time-consuming, especially when it involves repetitive formatting and table creation. You can automate this process by using a custom Word template that automatically fills in the connection design results. This template can be customized to fit your needs. VIKTOR offers multiple features that simplify report generation and lets you download and share the reports with your team, ensuring consistent and organized documentation with minimal effort.
How can I try this app?
The best thing about this app is that it is open source. You can find the code on GitHub and change it to fit your design needs. It is super simple to edit, like building with blocks.
Conclusion
If you have made it this far, I think you are convinced that creating a web app to automate time-consuming tasks like checking and designing connections from ETABS results is the way to go. From preprocessing to automating reports, this solution truly saves you time and lets you focus on the awesome instead of doing repetitive, boring tasks.
It has never been so easy to create web apps to automate complex engineering. Create a free VIKTOR account and start building your own automation tools today!
