Juggling data under pressure
We have all been there, working under a tight schedule with multiple teams relying on you to deliver structural results or insights. Maybe a geotechnical engineer needs reaction loads organized and processed, or a steel manufacturer requires internal loads at the ends of steel members. All of these are data points that need to be in a certain format for software packages such as ETABS and SAP2000.
How can you remove some of these bottlenecks and deliver faster results without losing the accuracy and trustworthiness of programs like ETABS?
Automating and sharing made easy
The ideal solution should do three things:
-
Automate repetitive tasks to save time and reduce human errors.
-
Make your data accessible for easy collaboration.
-
Be easy to implement, without requiring extensive development effort.
For instance, you could create a Python script to automate the processing of rows of Excel data and then use this Excel file as the input for ETABS. While this can save time, it often creates a new challenge: sharing this data with the whole team. Not everyone is familiar with Python, which means distribution and version control can become another obstacle.
A better alternative is a web application that connects the Excel sheet and ETABS. By automating workflows and providing a user-friendly interface, a web app makes results accessible to all team members – even those without Python skills. Of course, the implementation should be easy; you don't want to spend weeks building a solution like this, hiring a bunch of developers, or end up reinventing the wheel.
In the next section, we will dive into how you can build such a solution by integrating ETABS into a web app efficiently, transforming your workflows into streamlined and collaborative processes!
Integrating ETABS in a Web App
Integrating ETABS into a web app involved three main steps:
-
Exporting data from ETABS into your web app: this can be done manually into an Excel sheet or by connecting your app with the [ETABS API](link to ETABS API).
-
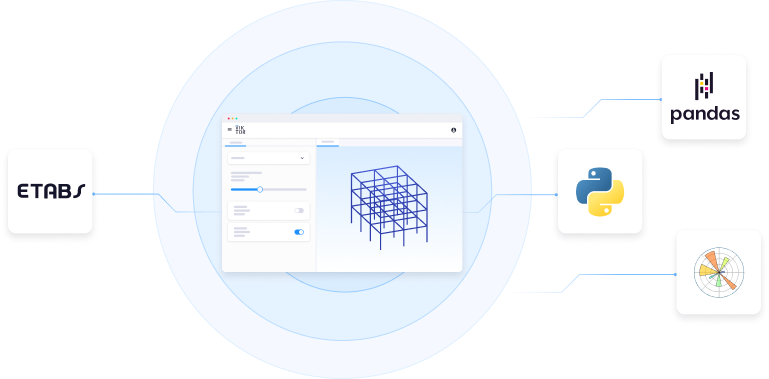
Handling this data efficiently: Depending on the project, you may end up with 100s of even 1000s of rows of data. I recommend using Pandas to handle this data and post-process the results (filtering, formatting, etc.).
-
Creating clear visualizations: this is where Matplotlib comes in handy, as it can be used to create compelling visualizations.
Now you may think that creating a web application from scratch sounds very intimidating. That is why there are platform you can use to automate these tasks.
One example of such a platform is VIKTOR; a platform to create web applications with Python that not only automate a larger portion of your workflow but also offer a user-friendly interface in which you can collaborate with colleagues.
How to connect your app with ETABS?
Working with the ETABS API in a VIKTOR web app is very similar to what you are used to. All the Python code you have already written can be adapted into a web app. The differences are small, mainly caused by the fact that you are now building a web application that can be shared online.
The following image summarizes the process:
-
The worker is installed on your machine or server;
-
The web application triggers the execution of a Python script that uses the ETABS API;
-
This script runs the ETABS analysis;
-
The results are sent to the worker;
-
The worker then sends them back to the web application.
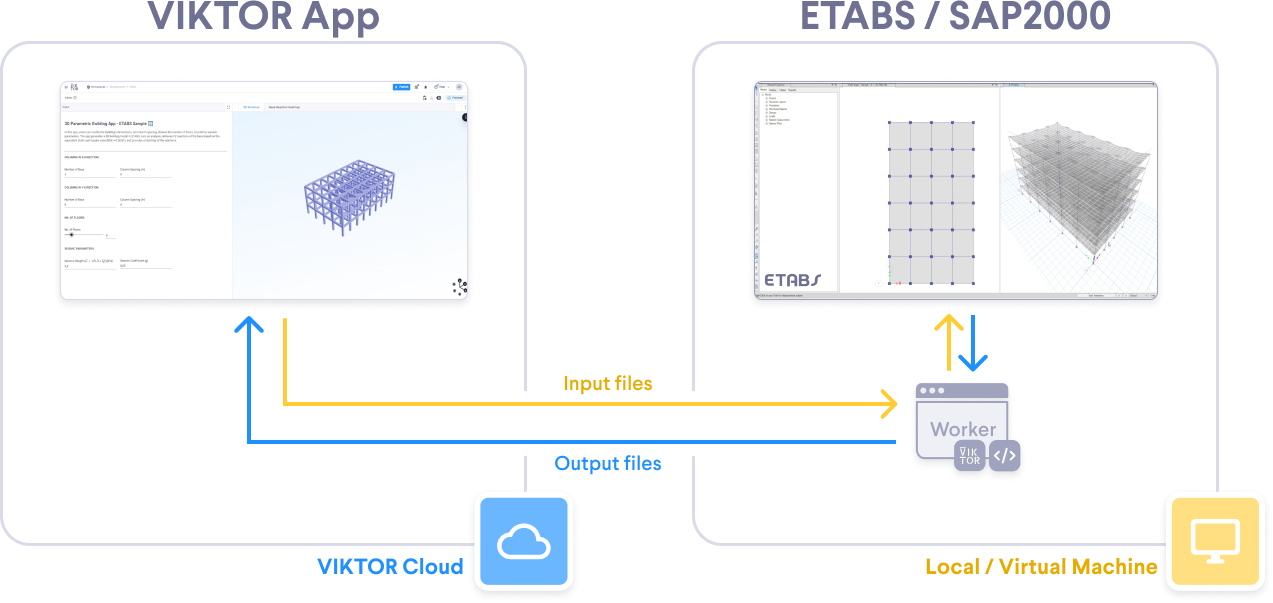
In some cases, it's even simpler as there is no need to integrate the ETABS API directly into the app. For simpler apps you can just export the ETABS results and upload them. The app will then post-process the data and create the visualization, as we will see in the next section.
Visualize and share your results
After the ETABS analysis is completed and the results are sent back to the app, the data is post-processed using Pandas. Python and Pandas integrate seamlessly into your web app, just as you would use them in your daily workflow. You can even display tables and data frames in your app with ease. The same applies to visualization libraries like Matplotlib or Plotly.
It is straightforward to reuse your existing code or write new code. VIKTOR provides various tools to create interactive graphs, such as line plots, scatter plots, and histograms, as well as table views, making it easy to visualize and explore your data.
The best part is that, since this is a web application, you can share it with your entire team! Let’s see this in action with our first example.
Example 1: Load and post-process ETABS data
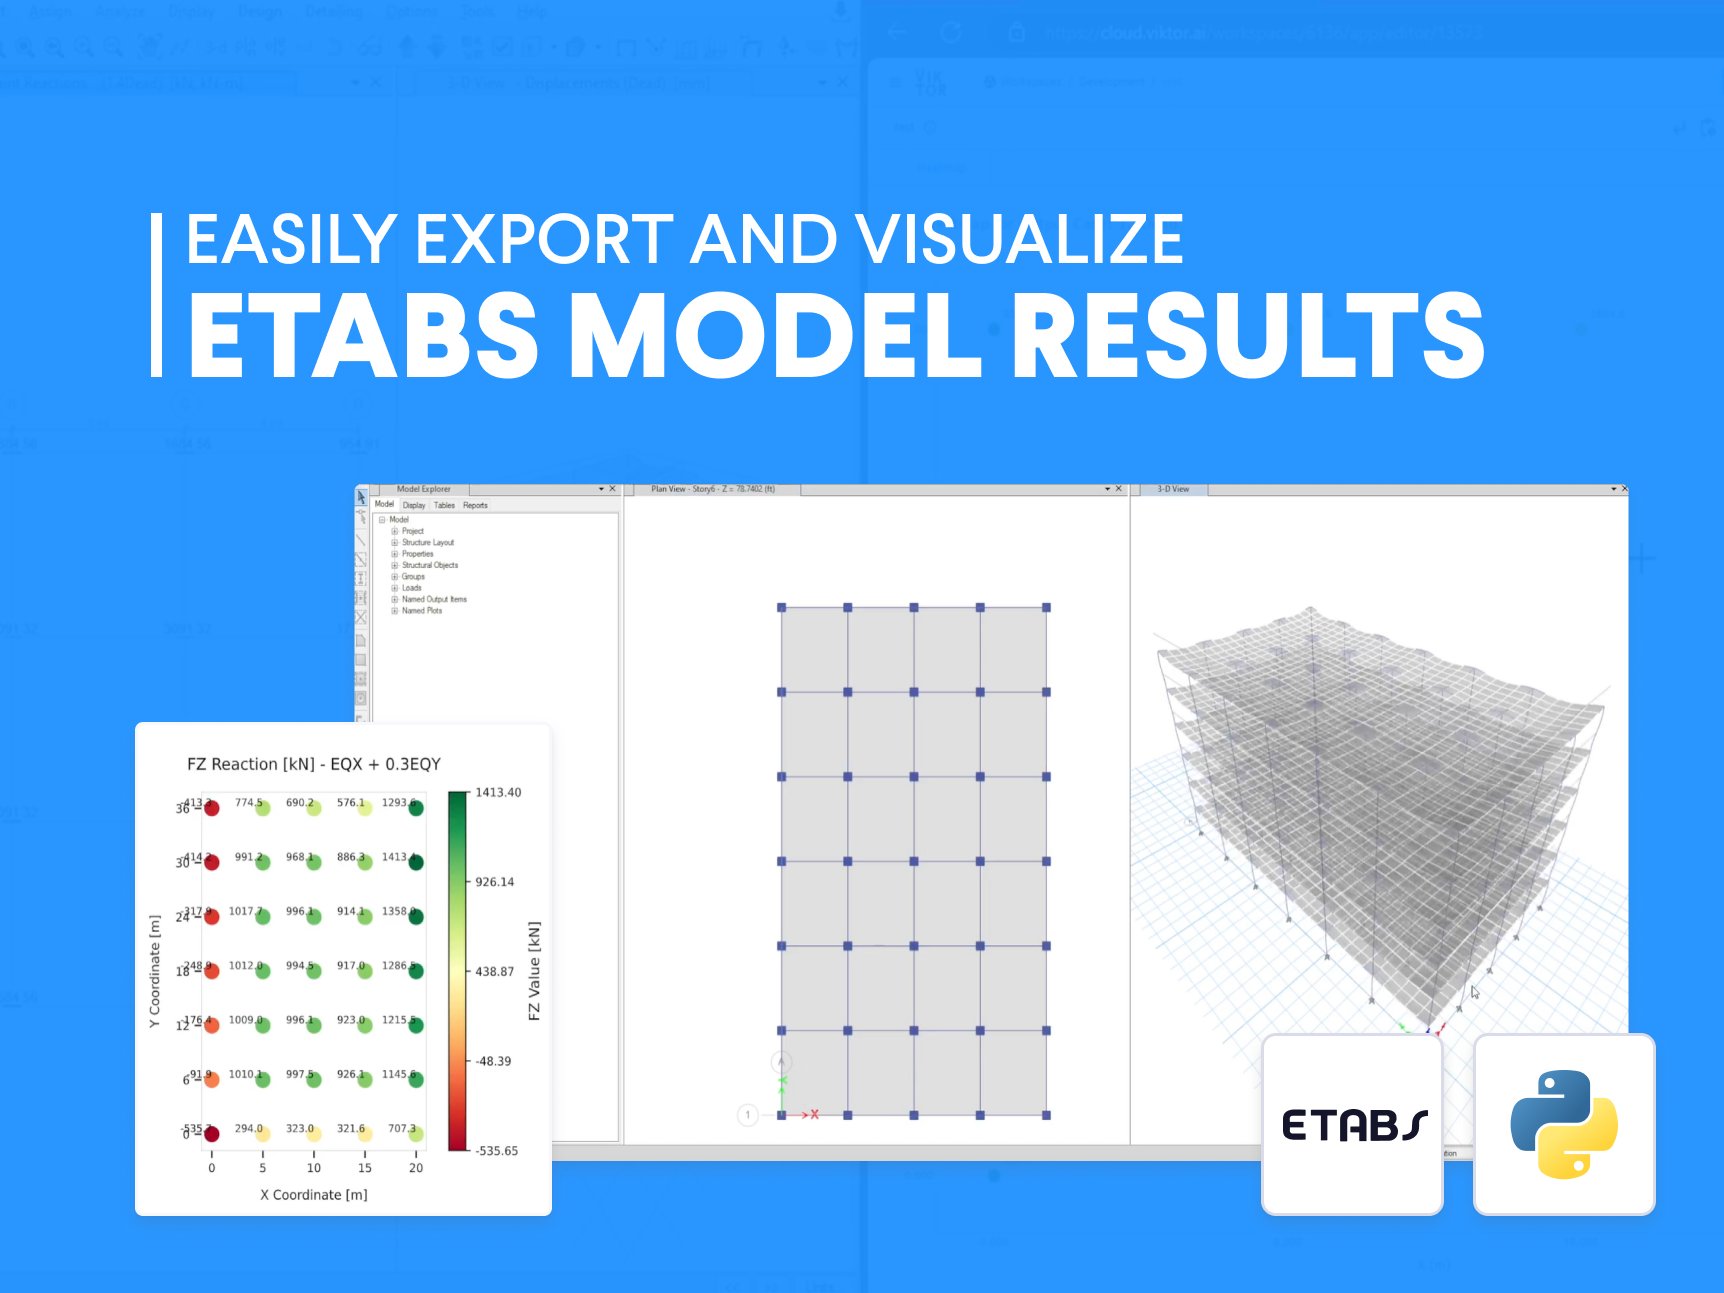
We will export ETABS model results to an XLSX file and load them into a web app to create a heatmap of reaction loads. The video below demonstrates how to visualize and export results in ETABS using a multi-story building as an example. It also explains how to handle ground-floor reaction loads and prepare the data for the web app.
Now we will create the components of the app shown on the right-hand side of the video below to automate the visualization and post-processing of our results.
Here are some quick questions for you:
-
How many lines of code do you think this app requires?
-
Is it difficult to build?
The answer is no. You can create this app in under 100 lines of code. And the best part? It only takes a few minutes!
Take a look at the code. If something is unclear, do not worry. Check out this tutorial for a step-by-step guide.
1import viktor as vkt
2import pandas as pd
3import plotly.graph_objects as go
4import io
5
6def read_file(file) -> tuple:
7    # Load the bytes of your xlsx
8    file_content = file.file.getvalue_binary()
9    sheet_names = ["Joint Reactions", "Objects and Elements - Joints"]
10    excel_data = io.BytesIO(file_content)
11    dataframes = pd.read_excel(excel_data, sheet_name=sheet_names, skiprows=1)
12    # Process the 'Joint Reactions' dataframe
13    loads_df = dataframes["Joint Reactions"].dropna(subset=["Unique Name", "Output Case"]).copy()
14    # Process the 'Objects and Elements - Joints' dataframe
15    cords = dataframes["Objects and Elements - Joints"].dropna(
16        subset=["Element Name", "Object Name", "Global X", "Global Y", "Global Z"]
17    ).copy()
18    # Rename columns without using inplace=True
19    cords = cords.rename(columns={"Object Name": "Unique Name"})
20    # Get load cases
21    unique_output_cases = loads_df["Output Case"].unique().tolist()
22    merged_df = pd.merge(loads_df, cords, on="Unique Name", how="inner")
23    return unique_output_cases, merged_df.reset_index(drop=True)
24
25def get_load_combos(params, **kwargs):
26    if params.xlsx_file:
27        result = read_file(params.xlsx_file)
28        return result[0]
29    return ["First upload a .xlsx file"]
30
31class Parametrization(vkt.Parametrization):
32    title = vkt.Text("# ETABS Reaction Heatmap")
33    sup_title1 = vkt.Text("## Upload your .xlsx file")
34    text1 = vkt.Text("Export your ETABS model results to an .XLSX file and upload it below.")
35    xlsx_file = vkt.FileField("**Upload a .xlsx file:**", flex=50)
36    lb = vkt.LineBreak()
37    sup_title2 = vkt.Text("## Select your load combinations")
38    text2 = vkt.Text('''After uploading your Excel file, select the load combination you want to visualize. Ensure the file includes the tables: **Joint Reactions** and **Objects and Elements - Joints**.''')
39    load_com = vkt.OptionField("Available Load Combos", options=get_load_combos)
40
41class Controller(vkt.Controller):
42    parametrization = Parametrization
43
44    @vkt.PlotlyView("Heatmap")
45    def plot_heat_map(params, **kwargs):
46        if params.load_com:
47            merged_df = read_file(params.xlsx_file)[1]
48            filtered_df = merged_df[merged_df["Output Case"] == params.load_com]
49            FZ_min, FZ_max = filtered_df["FZ"].min(), filtered_df["FZ"].max()
50            fig = go.Figure(
51                data=go.Scatter(
52                    x=filtered_df["Global X"],
53                    y=filtered_df["Global Y"],
54                    mode='markers+text',
55                    marker=dict(
56                        size=16,
57                        color=filtered_df["FZ"],
58                        colorscale=[
59                            [0, "green"],
60                            [0.5, "yellow"],
61                            [1, "red"]
62                        ],
63                        colorbar=dict(title="FZ (kN)"),
64                        cmin=FZ_min,
65                        cmax=FZ_max
66                    ),
67                    text=[f"{fz:.1f}" for fz in filtered_df["FZ"]],
68                    textposition="top right"
69                )
70            )
71            fig.update_layout(
72                title=f"Heatmap for Output Case: {params.load_com}",
73                xaxis_title="X (m)",
74                yaxis_title="Y (m)",
75                plot_bgcolor='rgba(0,0,0,0)',
76            )
77
78            fig.update_xaxes(
79                linecolor='LightGrey',
80                tickvals=filtered_df["Global X"],
81                ticktext=[f"{x / 1000:.3f}" for x in filtered_df["Global X"]],
82            )
83            fig.update_yaxes(
84                linecolor='LightGrey',
85                tickvals=filtered_df["Global Y"],
86                ticktext=[f"{y / 1000:.3f}" for y in filtered_df["Global Y"]],
87            )
88            return vkt.PlotlyResult(fig.to_json())
Let’s continue with the second example!
Example 2: Generate, analyze, and post-process ETABS models
To showcase the complete automation, we will create a web app that allows users to input basic building parameters, such as the number of stories, bays, and spacing in both directions. Additionally, users can define a seismic coefficient, which the app uses to calculate the Equivalent Horizontal Forces (EHF) applied to the structure during the analysis. Finally, the result of the base reaction will be displayed in our web app using a heat map. You will see a 3D model of the building in our web app and how the 3D model changes when the user inputs a new set of parameters.
You don’t need to be a front-end expert with lots of experience in HTML or JavaScript to build this app; adding all the input fields is really simple.
1# Previous code omitted
2
3class Parametrization(ViktorParametrization):
4
5    intro_text = vkt.Text(INTRO_TEXT)
6
7    lb1 = vkt.LineBreak()
8
9    # Grid in X Direction
10
11    col_x_text = vkt.Text(COL_SPACING_X_TEXT)
12    number_of_bays_x = vkt.NumberField("Number of Bays", min=2, default=4, step=1)
13    column_spacing_x = vkt.NumberField("Column Spacing", min=1, default=5, step=0.5, suffix="m")
14
15    # Grid in Y Direction
16
17    col_y_text = vkt.Text(COL_SPACING_Y_TEXT)
18    number_of_bays_y = vkt.NumberField("Number of Bays", min=2, default=6, step=1)
19    column_spacing_y = vkt.NumberField("Column Spacing", min=1, default=6, step=0.5, suffix="m")
20
21    # No of floors
22
23    no_of_floors_text = vkt.Text(NO_OF_FLOORS_TEXT)
24    number_floors = vkt.NumberField("No. of Floors", variant="slider", min=1, max=12, default=6)
25
26    # Seismic parameters text
27
28    seismic_text = vkt.Text(SEISMIC_TEXT)
29    seismic_weight = vkt.NumberField("Seismic Weight ($G + \\psi0,3*Q$)", min=1, default=5.5, step=0.1, suffix="kPa")
30    seismic_coeff = vkt.NumberField("Seismic Coefficient", min=0.01, max=3, default=0.25, step=0.01, suffix="g")
The same goes for the 3D model you saw in the previous section. VIKTOR has low-code components, such as a GeometryView, to render the 3D structure, which you can use to preview the structure that will be generated in ETABS.
Next, connecting the worker with your app is simple and can be done in just a few minutes, allowing you to easily work with the ETABS API. Check out the complete repository for this app to see how straightforward it is. If needed, you can always revisit the tutorial to refresh your knowledge.
Finally, the video below shows how the app displays a heatmap of the reaction loads, bringing all the components together. This kind of visualization helps you and your team leverage complex data more effectively, enabling clearer insights and better decision-making.
Conclusion
In this blog, we addressed a common challenge that structural engineers face, which is exporting analysis results from ETABS and processing them efficiently. We demonstrated two approaches in VIKTOR, one for manually exporting results and another as an end-to-end solution. These examples show how you can save time and reduce errors in your workflow.
But this is just the beginning – you can create all kinds of powerful automations to enhance every aspect of your SAP2000 and ETABS workflows by building your own web apps on the VIKTOR platform!
