August 23, 2023
Get insight into app usage with VIKTOR’s Activity Dashboard
by VIKTOR
Download the White Paper and get INSPIRED
Learn how you can boost digital transformation in your organization by focussing on people, rather than technology.
Empowering VIKTOR admins with insights
To ensure the effective adoption of your organization's apps, it's important for admins to monitor each app's usage and activity. The Activity Dashboards help track app usability, developer and user activities. You can find a user-friendly overview of data on:
- Users Activity
- Usage Patterns
- Workspace Activity
This helps admins answer questions like:
- Are all eligible persons using the available apps?
- Which apps and workspaces are being used most often?
- Which apps and workspaces still require attention?
That will ultimately help improve both app performance and adoption.
The Activity Dashboard Explained
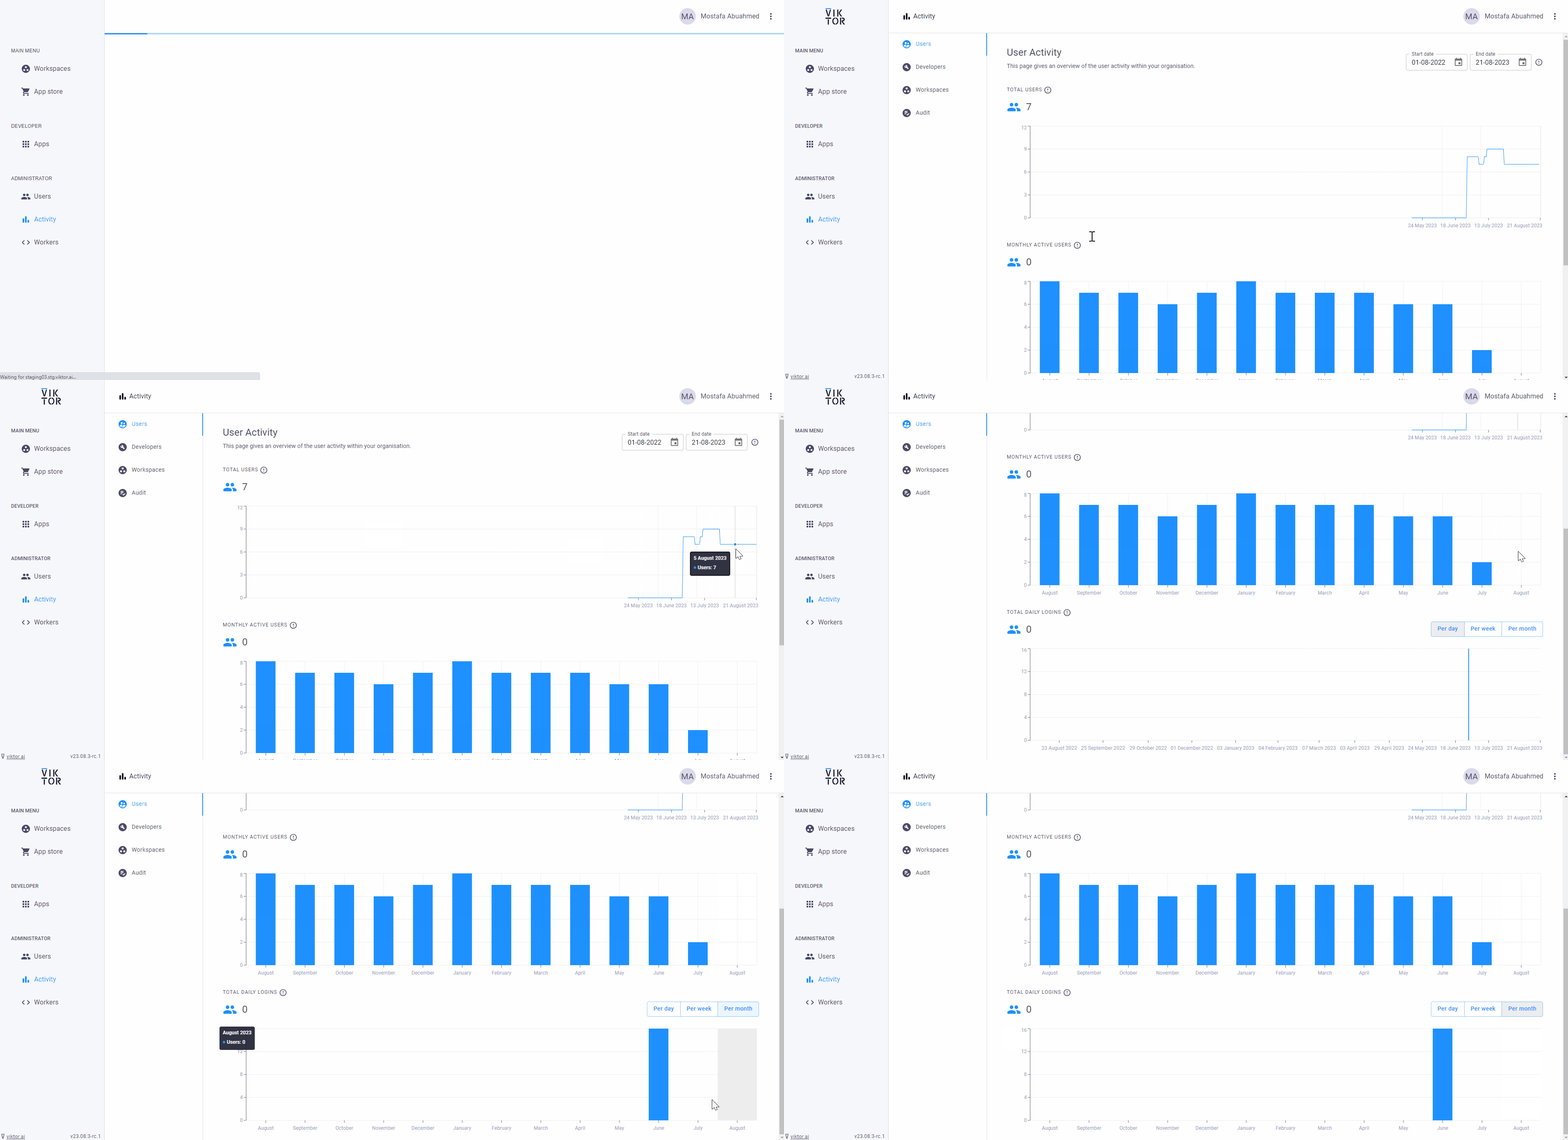
With this feature, admins review organization activities through analytics in the Administrator menu. The activity dashboard consists of four components: Users, Developers, Workspaces, and Audit.
- Users: This tab shows the number of users and their activity growth over time. An overview of user activity, displayed through time series graphs, shows:
- Total users: all users in the organization (developers included)
- Monthly active users: unique users that logged in to the environment at least once during a month.
- Daily logins: individuals who use a workspace on a single day, excluding development and public workspaces.
- Developers: This tab shows the number of developers needed to assist the team and maintain the app. An overview of developer activity, displayed through time series graphs, shows:
- Total developers: individuals in the organization with developer access.
- Monthly active developers: unique developer access logged in to the environment at least once a month.
- Daily logins: individuals who use a development workspace on a single day
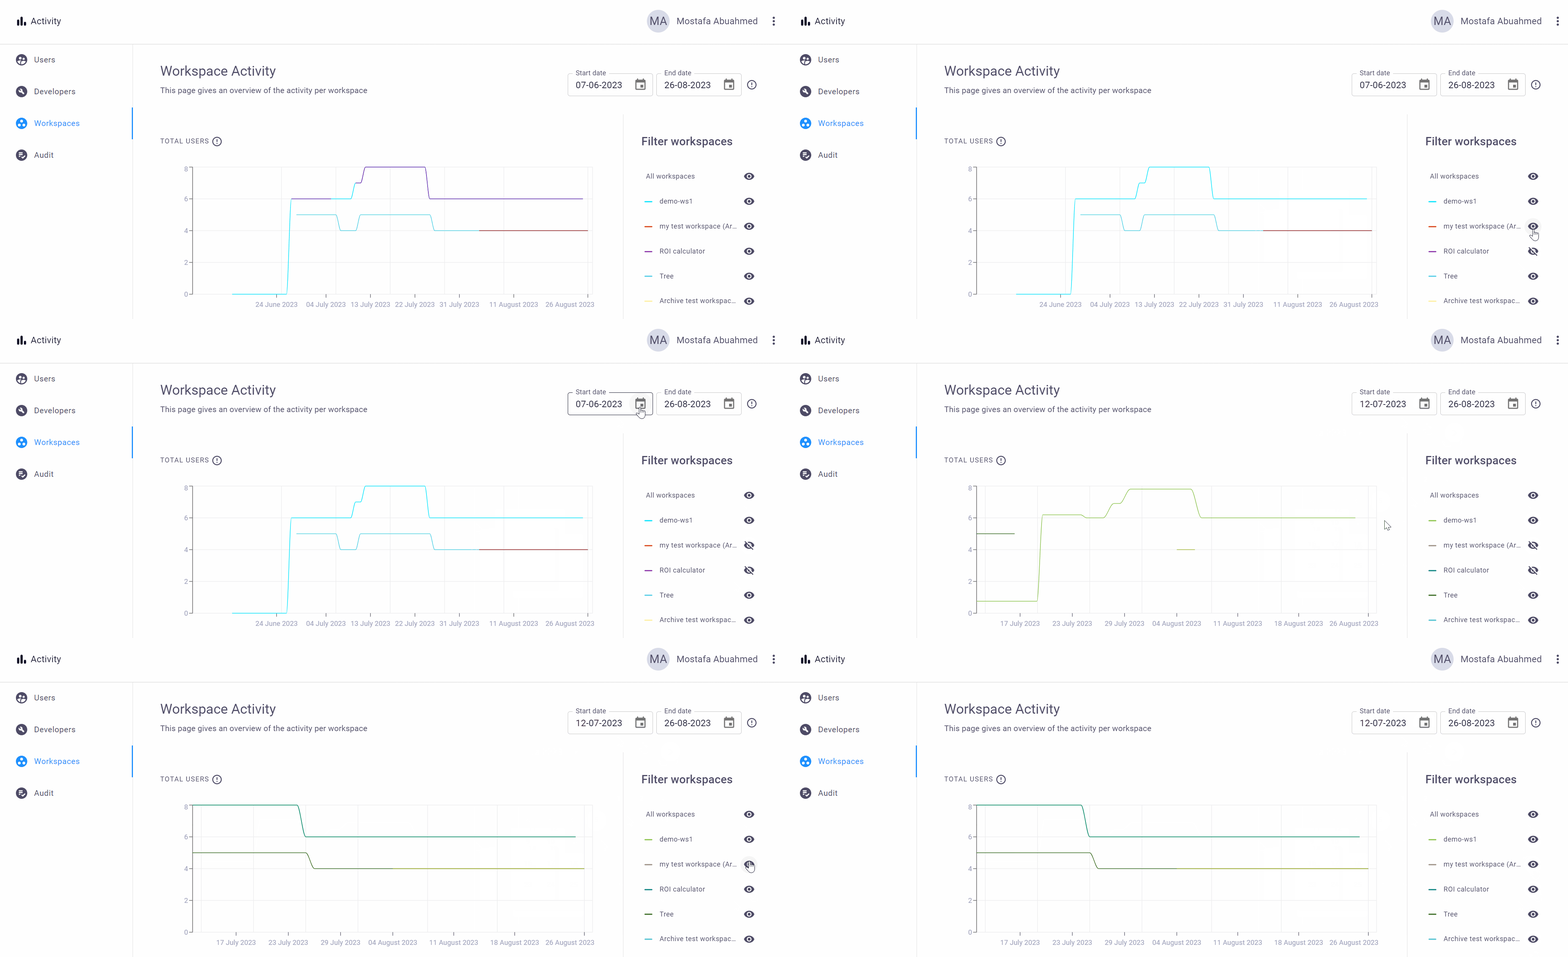
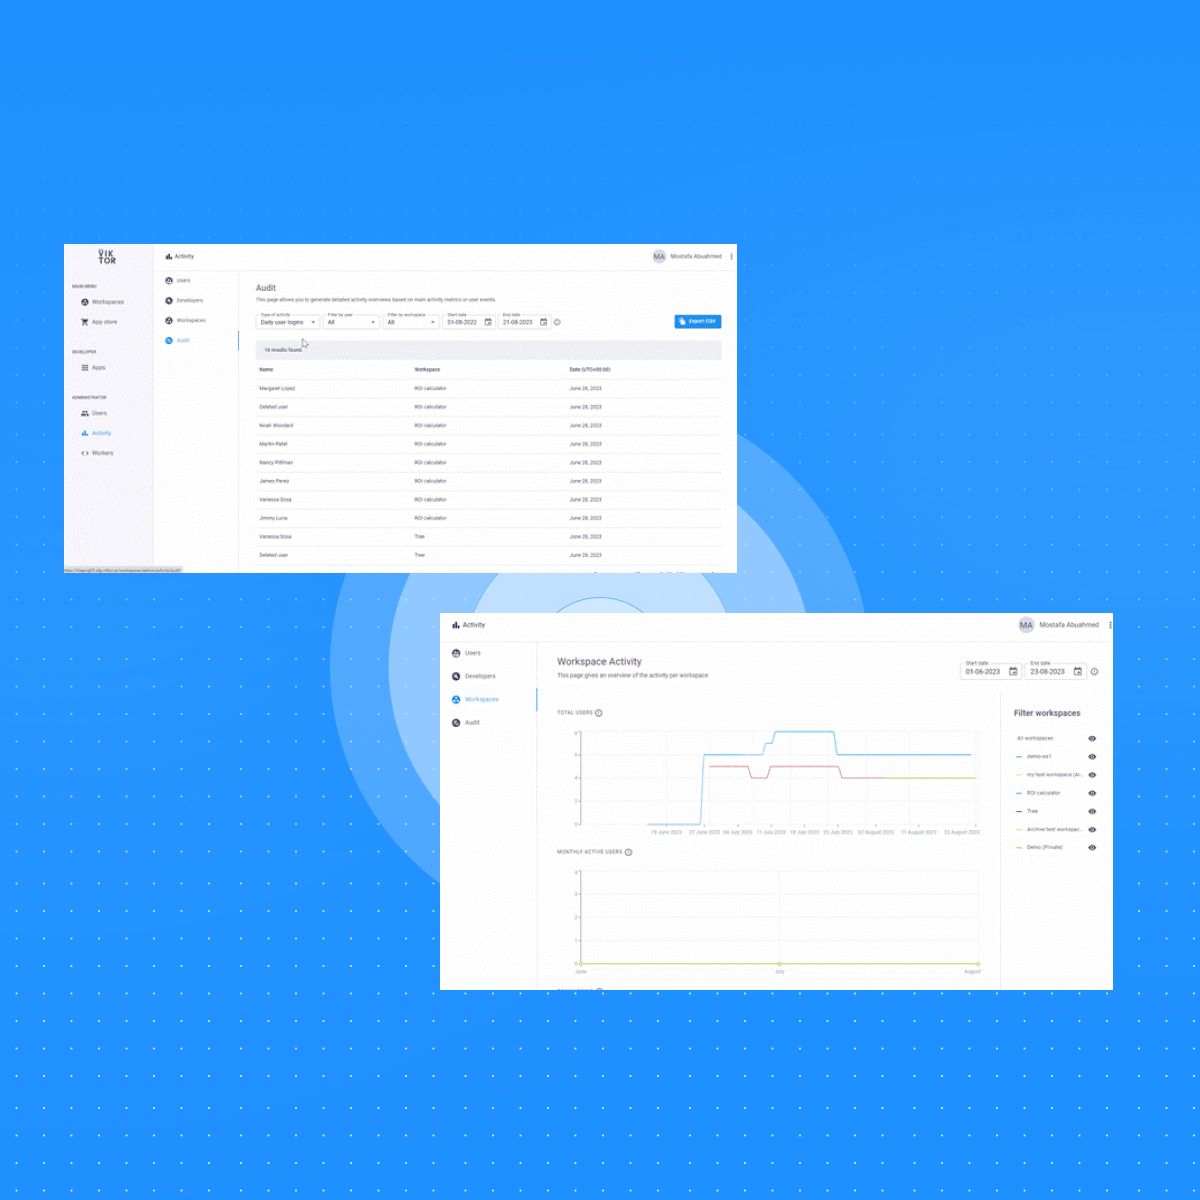
- Workspaces: Provides you with an overview of what is being used. Admins can have a breakdown of the total user activity into the activity on separate workspaces, including the total number of total users, monthly active users, and daily logins.
- Audit: If you want more detailed activity tracking, the audit tab uses previous components ( users, developers and workspaces) in addition to the possibility of inspecting User-Events. User activities are recorded as user events within VIKTOR. This filter allows you to inspect specific actions performed by users.
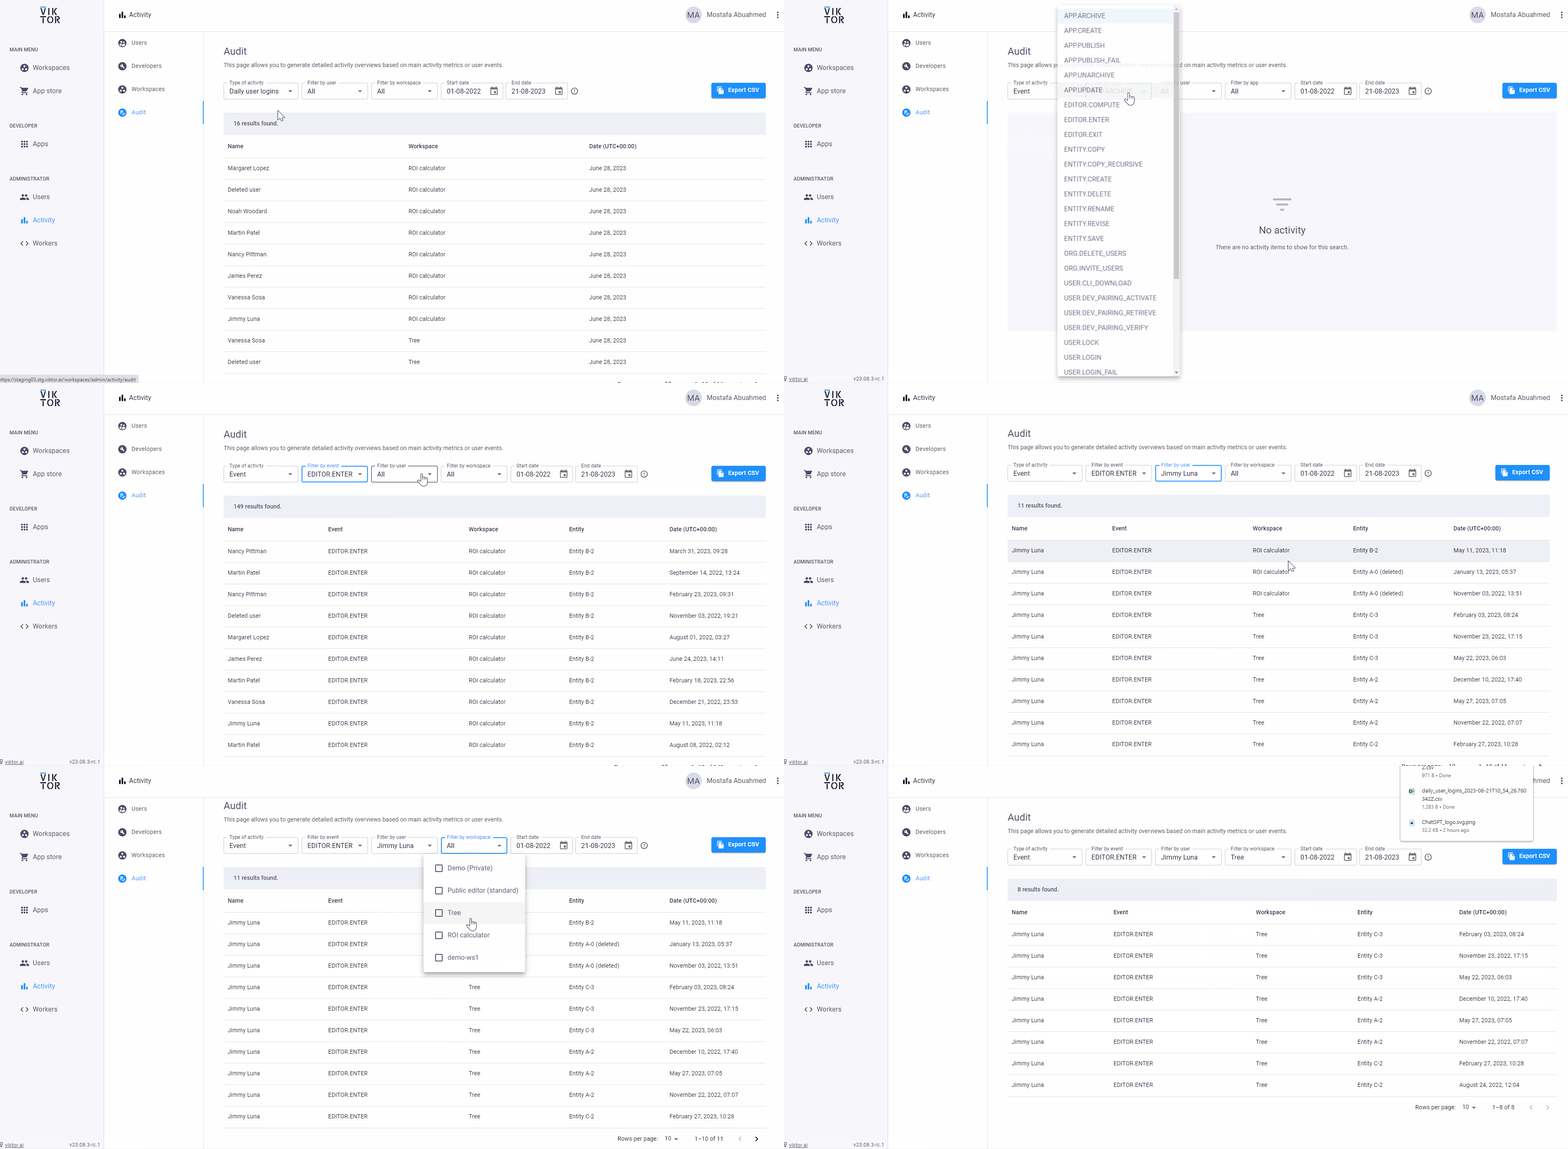
You can select the specific action that you want to inspect from the selection list. Each event shows relevant information such as:
- User performing the action
- Type of action
- The app, workspace, and entity related to the action
- Data and time
Additionally, it is possible to export the generated activity overview as CSV files, enabling further data analysis and visualization. This functionality ensures that you can gain deeper insights regarding use/development activities. Eventually, driving well-informed decisions for successful app adoption.
Industry Expansion with VIKTOR
VIKTOR supports growth with tools that perfectly match organizational needs. We assist teams with a platform to build enterprise-ready tools that are easy to implement. If you want to know more about what VIKTOR can do for your organization, please visit our Why VIKTOR for Enterprise page. Alternatively, you can check how VIKTOR supports global expansion in our article about Multi-regional Hosting.
We are excited to hear about your situation and discover how we can help your organization's digital transformation! Let's chat via: swolters@viktor.a
